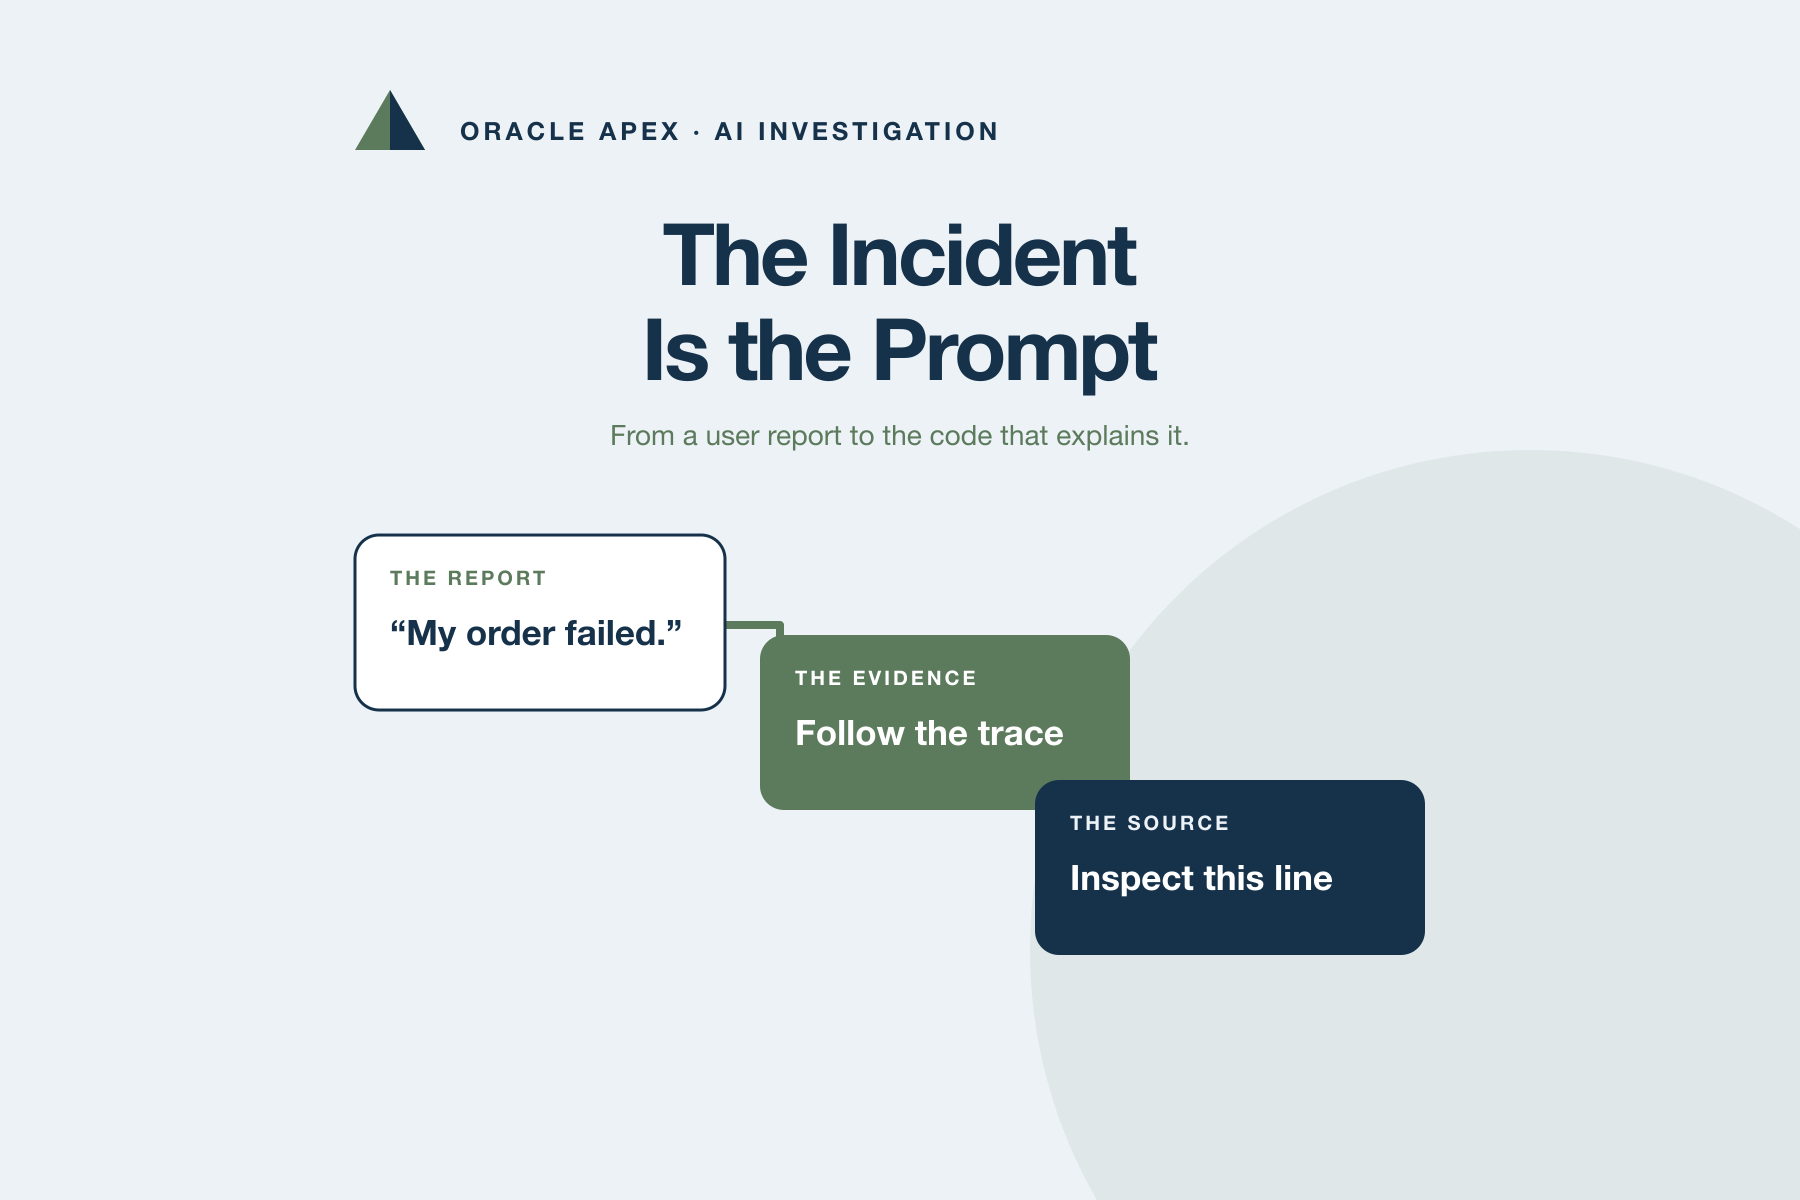
The Incident Is the Prompt
For this series, I want to explore AI beyond writing code: using those same tools to understand what happened when an application does not behave as expected.
The work between a screenshot and a diagnosis involves finding the execution, connecting its records, and deciding where to inspect the code. An early assumption can send that search in the wrong direction.
Good validation, exception handling, tests, and idempotency belong in the application whether or not an AI assistant is available. They prevent or contain failures, but even a friendly error message can leave a technical investigation unresolved. Making a failure understandable to the user and establishing its cause are different responsibilities. I want to explore the second without excusing weaknesses in the first.
Using VS Code with Codex, this three-part series follows progressively less obvious symptoms:
- The Incident Is the Prompt: follow a failed checkout from the support report to runtime evidence and code.
- One Click, Two Orders: determine whether two successful-looking orders represent separate purchases or repeated processing.
- The Missing Log Proves Nothing: confront competing explanations when the records do not tell the whole story.
For that purpose, I built B2B Order Forensics, a small APEX computer-store laboratory with synthetic purchases, deliberate faults, and simulated integration. Its cases are reproducible, not representative of production failure rates.
In a small schema you built yourself, this may seem like more machinery than the problem needs. Now imagine your first day maintaining an unfamiliar application with hundreds of objects and packages. Understanding the faulty assignment may be easier than knowing which records to examine and how they connect to the user’s report. This lab keeps the method inspectable; it does not reproduce an entire legacy system or prove gains at that scale. Controlled access, useful instrumentation, and version-matched source remain prerequisites, not knowledge the agent acquires automatically.
The support request: Order #10 failed
The buyer reviews a monitor purchase and clicks Place order. An Oracle error appears instead of a confirmation. Order #10 remains visible: the buyer can send that reference and a screenshot to support without knowing anything about APEX processes or packages.
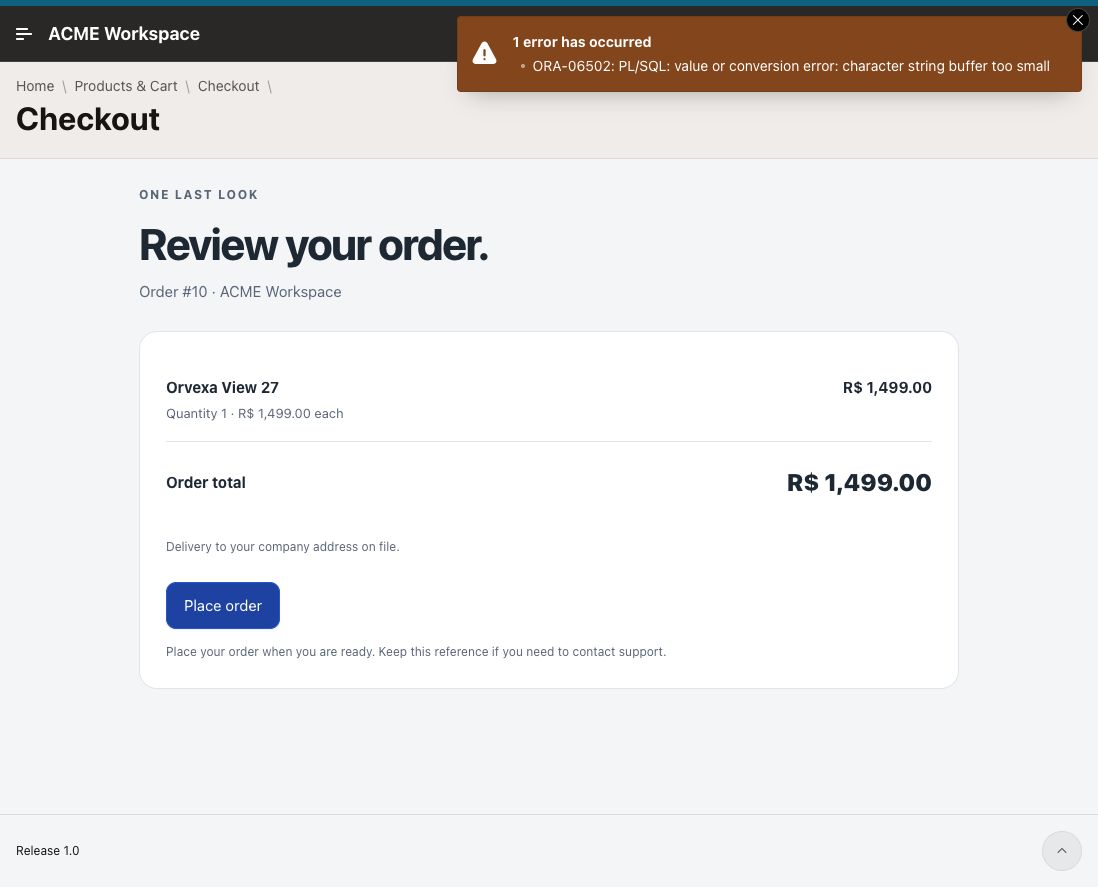
Figure 1. The buyer’s starting point: a failed checkout and an order reference.
A short request, with access boundaries already in place
The connection uses OCI Database Tools MCP, not the ORDS MCP runtime. Codex supports MCP in the IDE workflow; see the Codex MCP documentation.
Before the incident prompt, a separate instruction establishes the access contract: no changes, only authorized evidence sources, limited rows and time range, and explicit uncertainty. Logs and code comments are evidence, never instructions to the agent. The agent was also instructed to avoid seeds, solutions, and previous investigations, and to request source only when the evidence identified what it needed.
The support request below is the core of the prompt. I also supplied the exact incident window and authorized interface names after the agent requested scope:
Order #10 failed when I clicked Place order.
The attached screenshot is what the user sent to support.
Please investigate the cause. The incident occurred on September 12, 2026.
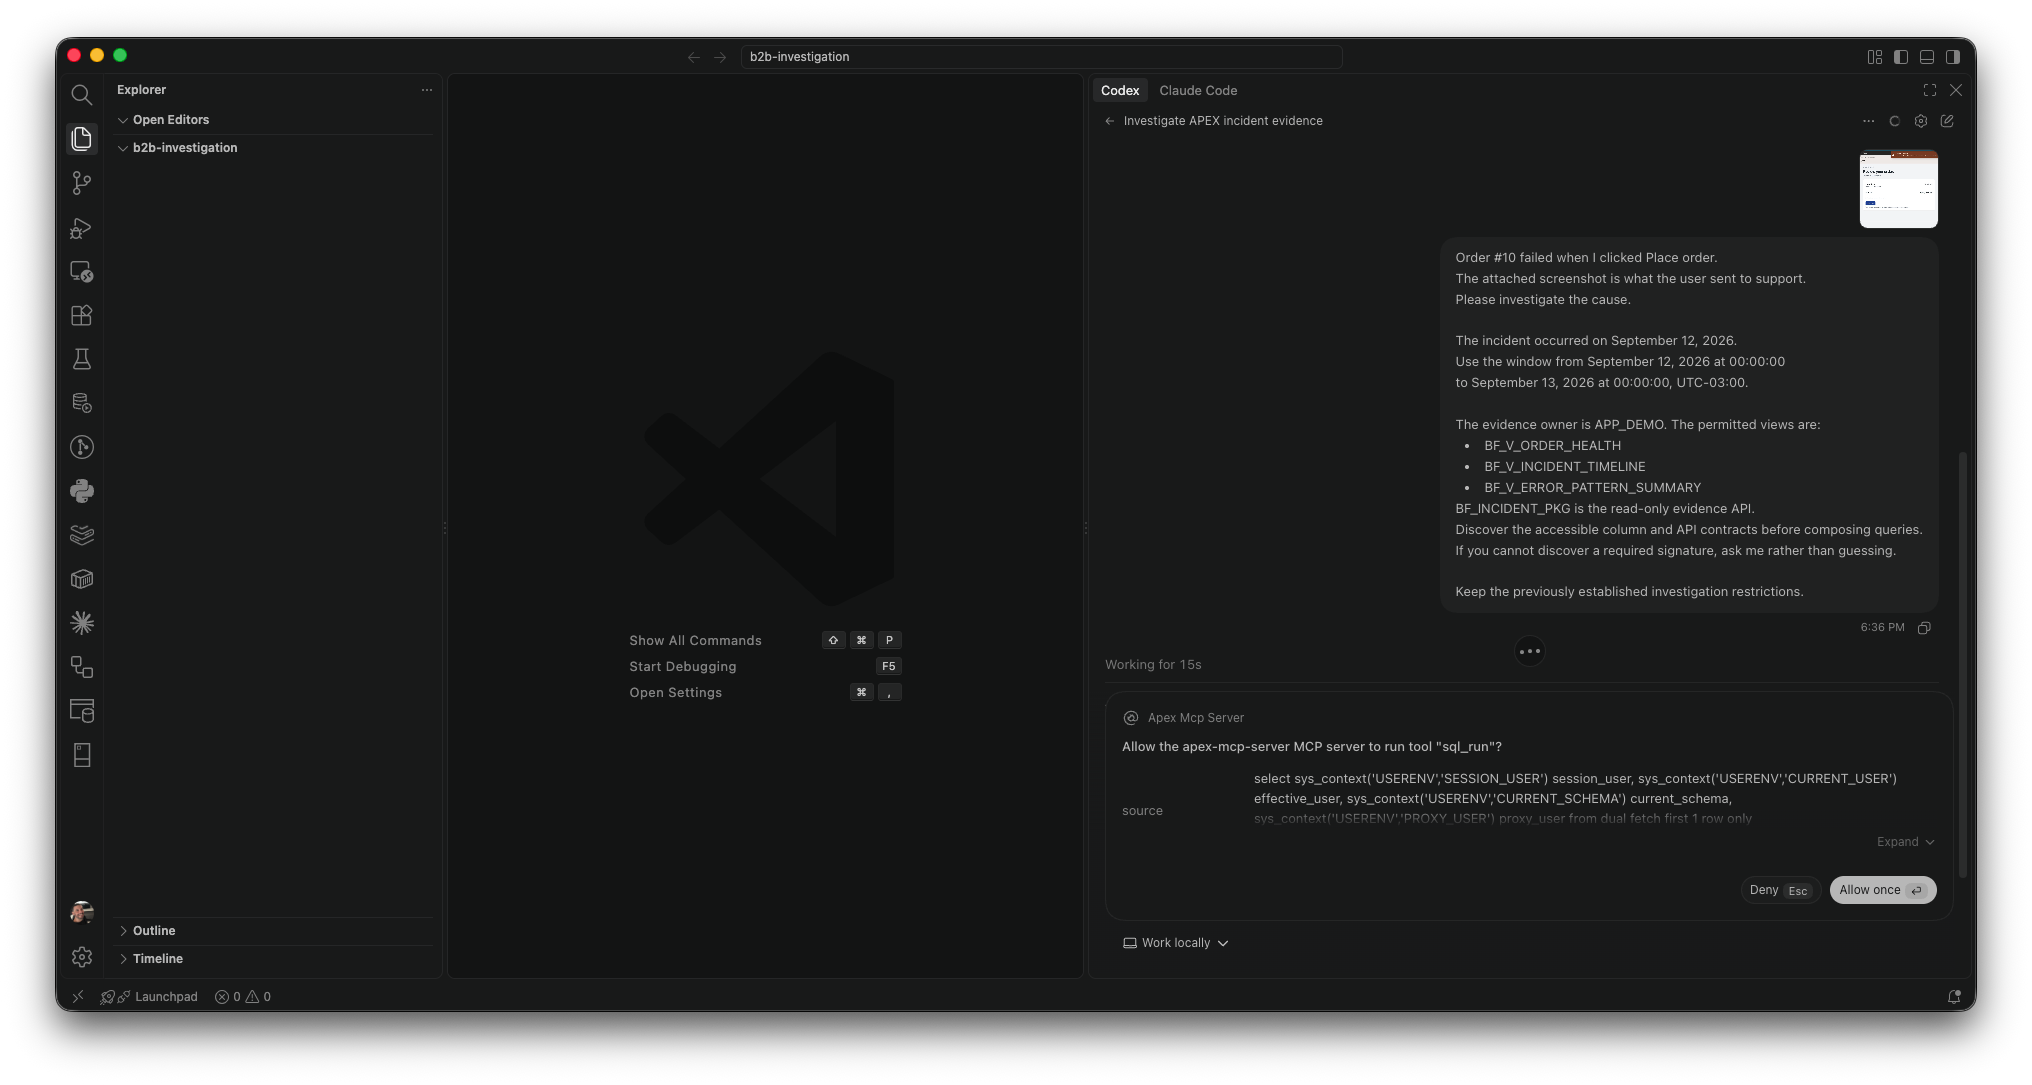
Figure 2. Starting with the support report and authorized scope, without supplying the faulty source fragment. The approval shown is not itself proof of execution.
The identity check returned the restricted account, BF_MCP_RO. I supplied the permitted interfaces and exact window after the assistant asked for them; it did not discover that scope on its own.
BF_MCP_RO has evidence grants on three views and a read-only package, not business tables or processing packages. The Built-in SQL Toolset can submit SQL and PL/SQL; database grants, not its name, restrict application access.
Finding the execution behind the order
Codex first checked which evidence fields and API parameters were available. It then located Order #10 and followed its correlation ID: the identifier that links records from the same processing attempt.
The order was marked ERROR. Its timeline contained eight events, including delivery validation, preparation, and the recorded failure.
The records narrowed the search to delivery preparation. They also supplied something more useful than the error message alone: the package and line where the failure occurred. Codex now had a specific piece of code to ask for.
This is a shortened reading of the result, with the identifying details retained:
Order #10 — delivery preparation
ORA-06502: character string buffer too small
APP_DEMO.BF_ORDER_PKG, line 87
Called through line 105
You do not need to read the full SQL to follow the investigation. It filtered one execution within the incident day and returned at most 100 rows. The technical reference below includes the original query and a longer result excerpt.
A backtrace is a pointer to where an error originated. Here, it directed the assistant to a small region of a package, rather than leaving it to search the entire application.
That pointer was not yet an explanation. The error indicated that a string did not fit its destination, but the logs alone did not identify the failing variable. Codex requested the body of BF_ORDER_PKG around lines 87 and 105, including the relevant declarations.
This was the useful intermediate result: a vague checkout complaint had become a precise request for source code.
From the backtrace to the assignment
After source was supplied, the assistant connected the input to this routine:
procedure prepare_delivery is
  l_service_code varchar2(8 char);
begin
  l_action := 'PREPARE_DELIVERY';
  event('DELIVERY.PREPARE', 'Preparing delivery request');
  l_service_code := l_order.delivery_service;
  event('DELIVERY.PREPARE', 'Delivery request prepared');
end;
PRIORITY_INTERNATIONAL contains 22 characters: eight in PRIORITY, one underscore, and thirteen in INTERNATIONAL. The receiving variable accepts eight. In the displayed package body, the declaration is at line 83, the assignment at line 87, and the call at line 105.
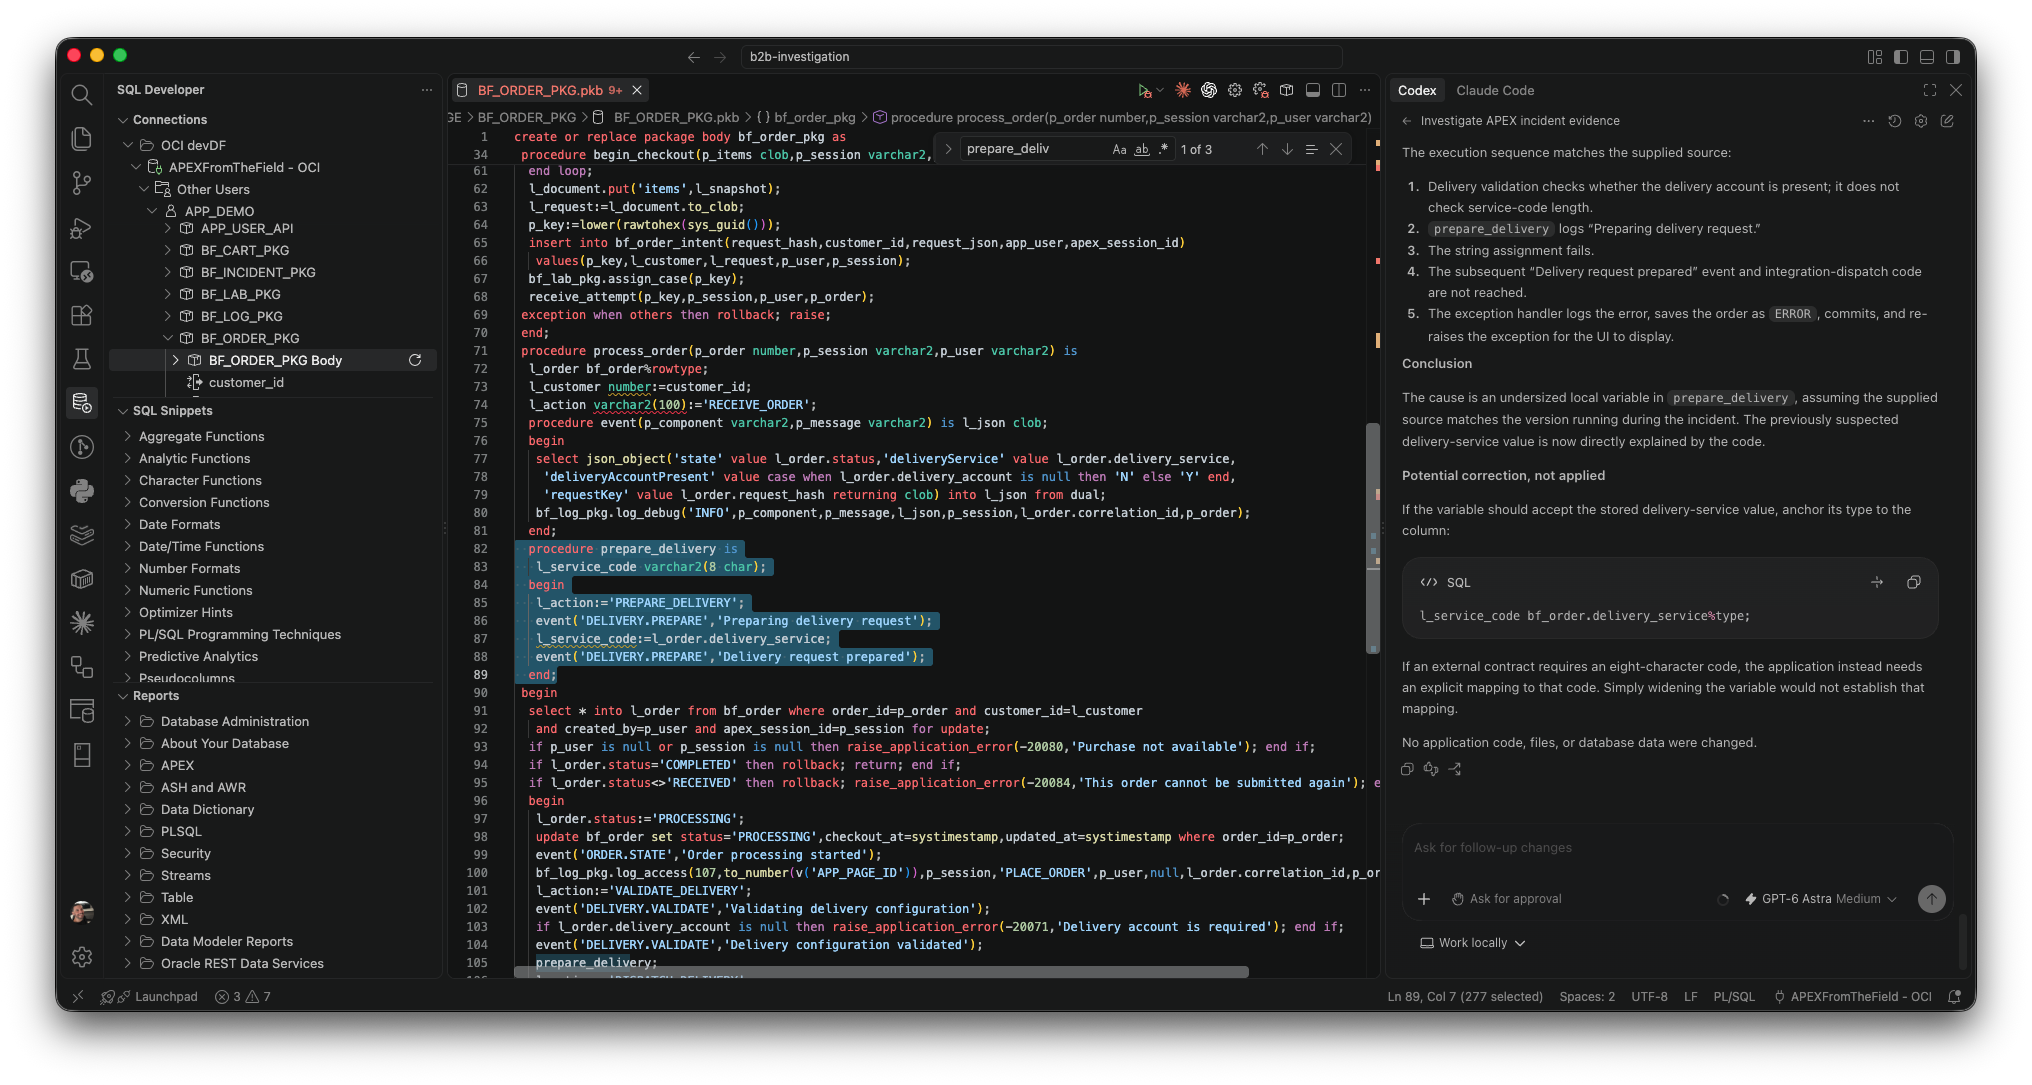
Figure 3. The backtrace leads to the receiving declaration and assignment. The conclusion preserves the source-version condition; the correction is explicitly not applied.
The supplied flow explains why delivery validation completed: it checked account presence, not whether this local variable could hold the service. Preparation logged its starting event, then the assignment failed before the subsequent completion event and simulated dispatch. The handler records the error, saves the order as ERROR, and re-raises the exception.
That is stronger than inferring a cause from an absent integration row. The failure location and supplied control flow explain the interruption; absence of a log alone would not.
One qualification remains: we have not independently proved that the supplied source is exactly the version that ran during the incident. It explains the recorded failure, and its line numbers agree with the backtrace, but the historical version match still needs verification. The assistant kept that condition in its conclusion.
A fix still needs a developer and a regression
A candidate correction, also proposed by the assistant, is a contract-consistent anchored type:
l_service_code bf_order.delivery_service%type;
This is appropriate only if the variable should accept the stored service value. If the receiving system requires an eight-character code, the application needs an explicit mapping instead. Widening the variable does not create that mapping; truncation could silently change the value’s meaning.
Proposed regression covers the failing service, short control and supported length boundary. Verify order state and simulated dispatch in an authorized test environment, never through the investigative identity.
These corrective tests have not been executed in the capture session; the lab retains its defect. Its visible error is not exemplary UX, regardless of the diagnostic evidence available behind it.
What happened behind that short answer
The final explanation is short. Getting there involved finding the order, following its execution, reading the failure records, and deciding which code to inspect.
| Work | What it contributed |
|---|---|
| Inspect the available evidence interfaces | Query the actual fields and parameters instead of guessing. |
| Locate the order and its correlation | Connect the user’s reference to a processing attempt. |
| Read the events and backtrace | Narrow the search to delivery preparation and a package location. |
| Compare the requested source with the input | Explain how the recorded value could fail at that assignment. |
For someone familiar with this package, these steps may be straightforward. For someone who has just inherited the application, knowing where to look is part of the job. That is the assistance I wanted to demonstrate.
The existing views and logging did part of the work. I supplied the scope and source; the assistant helped connect the evidence and focus the inspection. A developer still needs to verify the deployed version and choose a correction that respects the business contract.
No comparison measured time saved. The recovered records support this account, but they are not a complete transcript of every call. The technical reference separates those records from the agent’s retrospective.
Claude Code is an alternative for this method with equivalent restrictions; no separate execution or identical responses are claimed here.
Before Connecting an AI Agent to Production
This lab is not a complete production security design. Before using this approach with real application data, establish these boundaries.
Access
- Prefer sanitized evidence, a read-only replica, or carefully selected views over direct production access.
- Use a dedicated, traceable identity with least privilege enforced by the database. Deny changes to application data, DDL, and execution of business or administrative packages.
Human approval and limits
- Require approval for tool calls and separate human approval before applying a correction. A prompt is not an authorization system.
- Limit execution time, rows, periods, and response sizes. The lab’s 500-row and seven-day limits are procedural, not guaranteed by the generic SQL tool.
- Review proposed fixes and run reproducible tests before deployment.
Sensitive data and untrusted content
- Logs may contain personal information, payloads, secrets, or malicious instructions. Minimize what is sent to the model; keep credentials out of prompts, screenshots, and repositories.
- Treat database values and source comments as evidence, never as permission to take another action. This includes prompt injection embedded in retrieved content.
- Follow organizational policies for data retention, residency, and transmission to the model provider.
Audit and revocation
- Record tool activity with attribution to the user, agent, and model, and provide a quick way to revoke access.
- Verify the controls in the actual environment. A successful query does not establish auditing, safe token renewal, or production readiness.
Useful logs make an incident investigable. They do not excuse a poor error experience or replace prevention.
Try the code, then question the next symptom
The public B2B Order Forensics repository provides the application source, database DDL, PL/SQL packages, and investigation queries. It is an experimental laboratory with deliberate defects. Reading the preparation code reveals the incidents, so keep it outside an investigator’s initial context if you want to repeat the evidence-first exercise.
The next article, One Click, Two Orders, changes the problem: both orders can look successful. The investigation must establish whether they represent separate purchases or the same intention processed again, without relying on an exception to point toward the defect.
Technical reference
The investigation above can be followed without this section. These details are here for readers who want to inspect the query or understand how the evidence was retained.
Original timeline query
This SQL comes from the recovered MCP invocation. Only whitespace has been changed:
select
  to_char(event_at at time zone '-03:00',
          'YYYY-MM-DD HH24:MI:SS.FF3 TZH:TZM') event_at_local,
  source_type, event_type, severity, order_id, correlation_id,
  component_name, summary, detail_excerpt
from APP_DEMO.BF_V_INCIDENT_TIMELINE
where event_at >= to_timestamp_tz(
    '2026-09-12 00:00:00 -03:00',
    'YYYY-MM-DD HH24:MI:SS TZH:TZM')
  and event_at < to_timestamp_tz(
    '2026-09-13 00:00:00 -03:00',
    'YYYY-MM-DD HH24:MI:SS TZH:TZM')
  and correlation_id = '5b4e5a95b965ee0be063c15a000a6eaa'
order by event_at, source_type, event_type
fetch first 100 rows only;
The fixed window is September 12, 2026 in UTC−03, not a moving “today” filter. The correlation identifies the attempt, and the query caps the result at 100 rows. It returned eight.
The following is a selected projection of the returned fields, not another query or an image of the tool:
Order: 10
2026-09-12 15:37:50.911 -03:00
DELIVERY.PREPARE — Preparing delivery request
deliveryService: PRIORITY_INTERNATIONAL
deliveryAccountPresent: Y

2026-09-12 15:37:50.912 -03:00
PREPARE_DELIVERY
-6502: ORA-06502: PL/SQL: value or conversion error:
character string buffer too small
ORA-06512: at "APP_DEMO.BF_ORDER_PKG", line 87
ORA-06512: at "APP_DEMO.BF_ORDER_PKG", line 105

2026-09-12 15:37:50.914 -03:00
ORDER.STATE — Order processing stopped
state: ERROR
The bundle reports the error time as 18:37:50.912Z, consistent with the UTC−03 presentation. Equal displayed timestamps do not prove strict execution order. The access record’s User: ADMIN refers to application-log content, not the MCP connection: the identity output reports BF_MCP_RO for session user, effective user, and current schema, with no proxy.
Why the records survived the failure
An investigation needs diagnostic records to survive the failed business operation. This lab writes them using autonomous transactions, which can commit independently of the caller’s transaction. That helps retain the trace when processing fails.
It is not a guarantee of complete logging. The logging operation can fail too, and this lab’s handlers can swallow their own logging exceptions. An absent record therefore needs interpretation, not an automatic conclusion.
Oracle documents autonomous transactions and FORMAT_ERROR_BACKTRACE, the mechanism used to record the originating source location.
What was recovered
The collected outputs include the identity check, view columns, API arguments, order health, evidence bundle, and timeline. One complete tool record contains the exact timeline query and result shown here. We do not have all original inputs or a complete ordered transcript.
The agent’s retrospective reports a repeated identity check; that is not another discovery. The bundle and timeline expose related evidence, so their agreement is a consistency check rather than independent corroboration. Screenshots of the subsequent source inspection document the explanation and its version qualification. No correction or regression test was performed in that capture session.