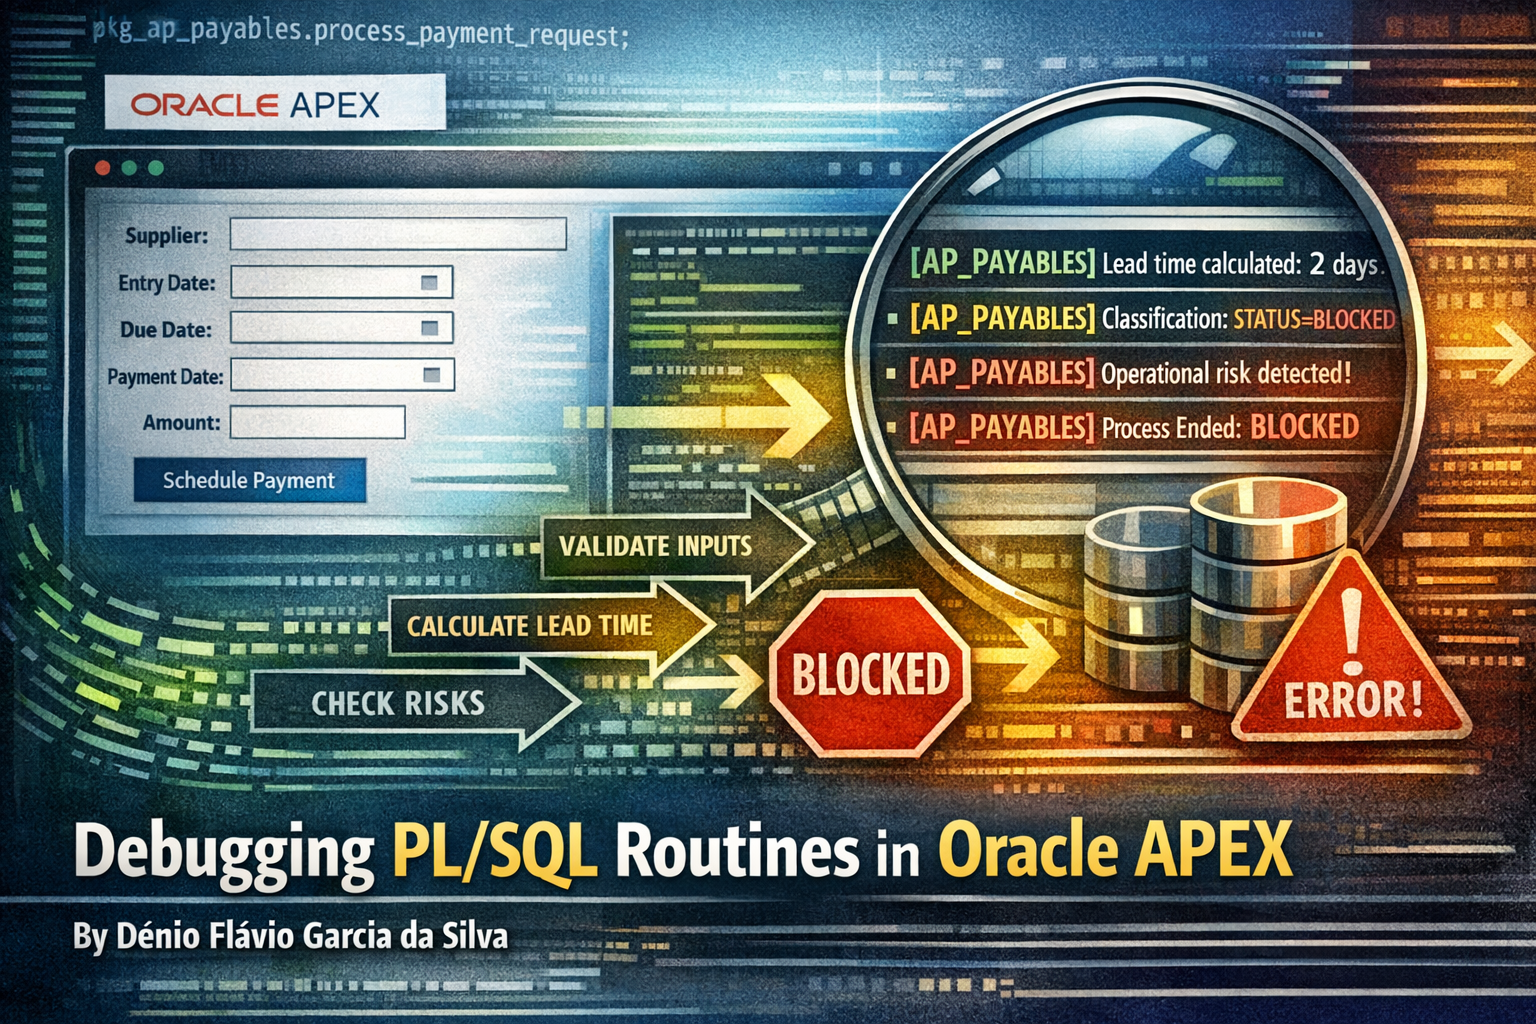
Instrumenting PL/SQL in Oracle APEX: A Practical Case Using APEX_DEBUG
By Dênio Flávio Garcia da Silva
There was a moment in my journey with Oracle APEX when I started working on larger enterprise applications and realized that the page itself was often the simplest part of the whole system. The UI looked clean and straightforward, but behind a single button there were packages with hundreds or sometimes thousands of lines of PL/SQL, nested procedures, multiple validations, and business rules that interacted in ways that were not always obvious.
When something failed in that environment, the visible error was rarely the real problem. The application might simply show a validation message or a generic exception, but the actual cause was buried somewhere deep inside the execution flow. Understanding what happened required tracing the entire chain of procedure calls.
That was when APEX_DEBUG stopped being just another API in the documentation and became one of the most valuable tools in my daily development workflow.
Instead of trying to mentally reconstruct the execution flow, I could instrument the code and observe exactly what happened during runtime. Instead of guessing which branch of logic was taken, I could see it. Instead of relying on assumptions, I could follow the execution path step by step.
In this post, I want to show a small but realistic case that demonstrates how APEX_DEBUG can be used to instrument complex PL/SQL routines behind an APEX page. A case really inspired “from the field”!
The focus here is not error handling or validations. The goal is to make the internal logic visible when debugging business routines that execute inside the database.
The Scenario
To illustrate this, we will use a simplified Accounts Payable scheduling routine.
In many companies, supplier payments cannot be scheduled immediately after the invoice is received. There is usually an operational rule that requires some minimum lead time between the entry of the payable title and the payment execution.
In our example, the business rule is simple:
- Payments scheduled 15 days or more after the entry date are considered normal.
- Payments scheduled between 10 and 14 days are still allowed but generate an operational alert.
- Payments scheduled with less than 10 days of lead time cannot be processed and must be renegotiated with the supplier.
The APEX page collects a few basic inputs:
- Supplier name
- Entry date
- Due date
- Payment date
- Amount
Behind the page, a PL/SQL package processes the request, evaluates the scheduling rules, and records the result.
The interesting part is not the rule itself. The rule is quite simple and we likely wouldn’t need debug to track this. The interesting part is how we instrument the entire process using APEX_DEBUG so that we can analyze the execution flow. Imagine you applying this approach in a very confusing scenario!
The Architecture of the Example
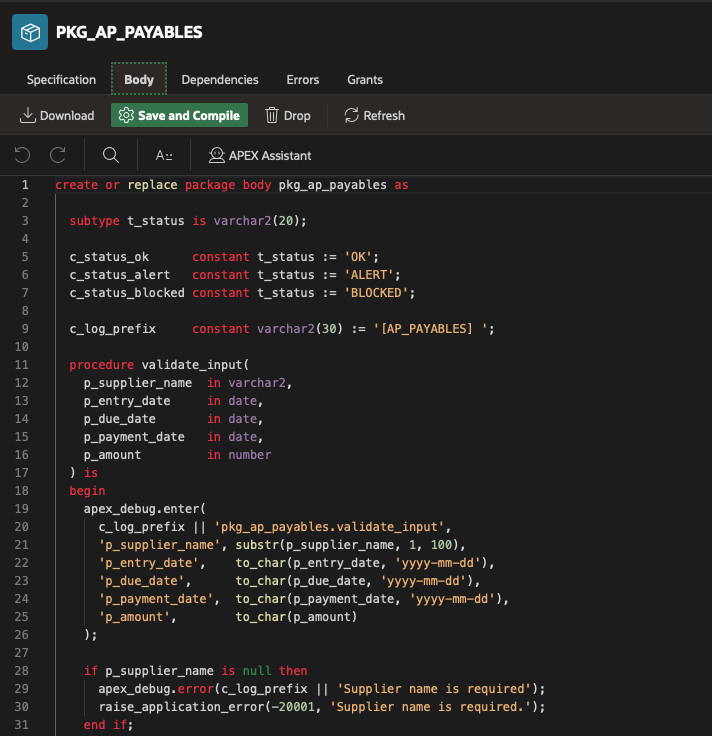
The logic behind the page is implemented in a PL/SQL package called:
PKG_AP_PAYABLES
Instead of placing all logic in a single procedure, the package breaks the routine into smaller steps:
- Input validation
- Lead time calculation
- Payment window classification
- Operational risk checks
- Status message construction
- Request persistence
Each of these steps writes structured messages into the APEX debug log.
This creates a very clear execution trail when debugging.
Creating Structured Debug Messages
One of the small details that makes the debug log much easier to read is using a custom prefix for all messages.
In this example, all log entries use the prefix:
[AP_PAYABLES]
This makes it easy to filter and identify messages produced by our own instrumentation.
Example:
apex_debug.info(
  '[AP_PAYABLES] Starting payables scheduling routine'
);Using a consistent prefix helps a lot when working in larger applications where multiple components may generate debug messages.
We can declare a constant value that will be used as prefix in every APEX_DEBUG call:
c_log_prefix constant varchar2(30) := '[AP_PAYABLES] ';Instrumenting the Execution Flow
The core idea of instrumentation is simple: make every important step visible.
Instead of only logging errors, we also log key events during the execution of the routine.
For example, when the payment lead time is calculated:
apex_debug.info(
  '[AP_PAYABLES] Lead time calculated: %s day(s)',
  to_char(l_lead_days)
);And when the payment window is classified:
apex_debug.info(
  '[AP_PAYABLES] Classification completed: status=%s, scheduled_flag=%s',
  p_validation_status,
  p_scheduled_flag
);These messages allow us to follow the decision process inside the business logic.
Using WARN for Operational Risk
Not every situation is an error.
Sometimes the system can continue processing but should highlight an operational risk.
For example, if the payment date is extremely close to the due date, the system might still allow scheduling but raise a warning.
apex_debug.warn(
  '[AP_PAYABLES] Operational risk detected: payment date is very close to due date.'
);This type of message is extremely useful during debugging because it shows that the system detected a risky condition even though the transaction was allowed.
Using ERROR for Critical Situations
When a critical validation fails, the routine logs the error and raises an exception.
apex_debug.error(
  '[AP_PAYABLES] Supplier name is required'
);This ensures that the debug log records the exact point where the process stopped.
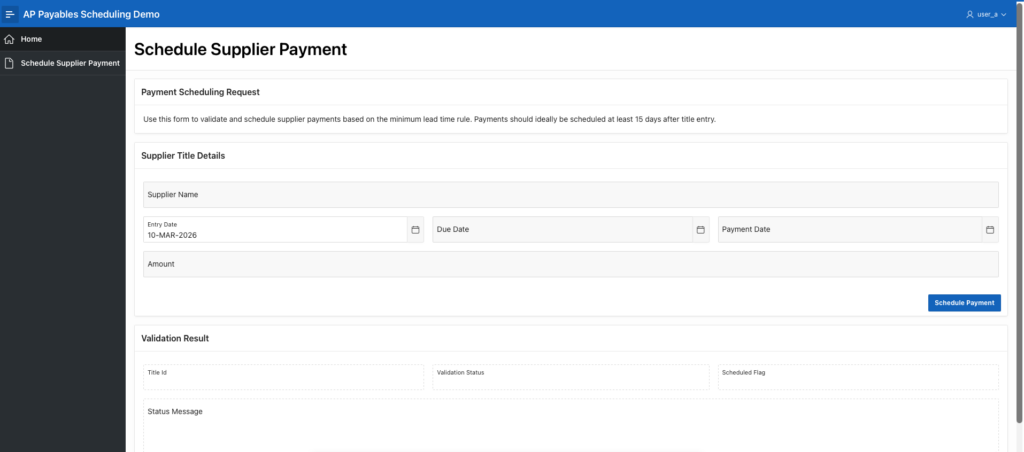
Executing the Process from the APEX Page
The APEX page itself is intentionally simple.
It collects the user input and calls the main package procedure:
PKG_AP_PAYABLES.PROCESS_PAYMENT_REQUEST
This is the process that runs when user clicks ‘Schedule Payment’:
declare
  l_title_id            number;
  l_validation_status   varchar2(20);
  l_validation_message  varchar2(500);
  l_scheduled_flag      varchar2(1);
  l_amount              number;
begin

  apex_debug.enable(p_level => apex_debug.c_log_level_app_trace);

  l_amount := :P1_AMOUNT;

  pkg_ap_payables.process_payment_request(
    p_supplier_name       => :P1_SUPPLIER_NAME,
    p_entry_date          => to_date(:P1_ENTRY_DATE, 'DD/MM/YYYY'),
    p_due_date            => to_date(:P1_DUE_DATE, 'DD/MM/YYYY'),
    p_payment_date        => to_date(:P1_PAYMENT_DATE, 'DD/MM/YYYY'),
    p_amount              => l_amount,
    p_title_id            => l_title_id,
    p_validation_status   => l_validation_status,
    p_validation_message  => l_validation_message,
    p_scheduled_flag      => l_scheduled_flag
  );

  :P1_TITLE_ID           := l_title_id;
  :P1_VALIDATION_STATUS  := l_validation_status;
  :P1_STATUS_MSG         := l_validation_message;
  :P1_SCHEDULED_FLAG     := l_scheduled_flag;
end;Reading the Debug Log
After submitting the page with debug enabled, we can inspect the debug log. You can find it in the developer toolbar.
What we see is a structured execution trace of the routine.
Instead of guessing what happened, we can see exactly how the process executed:
- Routine started
- Inputs validated
- Lead time calculated
- Payment classified
- Operational risks evaluated
- Request saved
Example: Payment Blocked
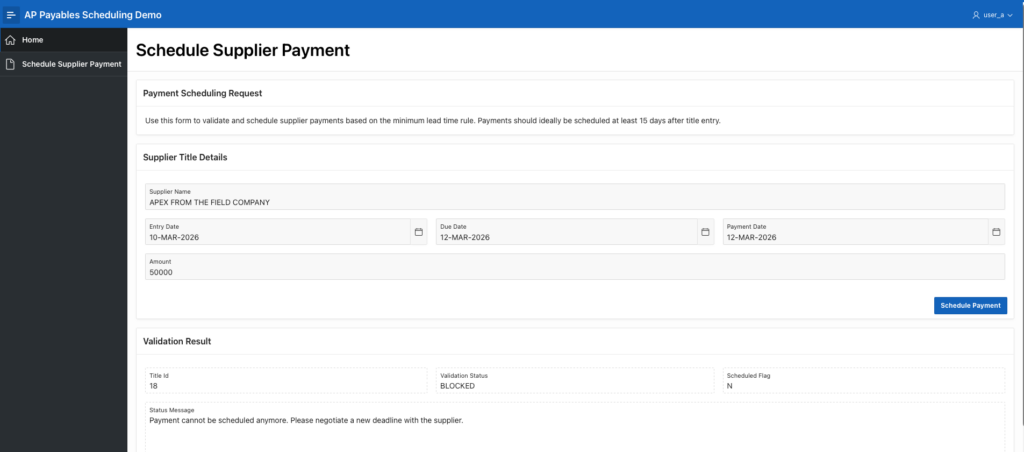
These inputs produced the following log:
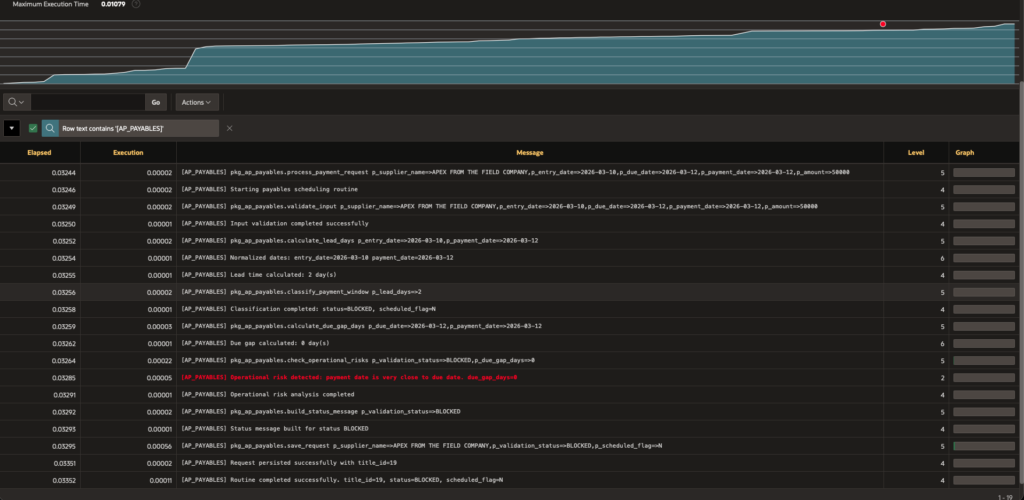
Here we can observe the exactly path that the process executed.
This log shows a payment request being processed normally from start to finish. The routine validates the input, calculates the lead time between entry and payment date, and finds only 2 days, which is too short for the scheduling rules. Because of that, the request is classified as BLOCKED.
Then the system checks the gap between the due date and the payment date and finds 0 days, meaning payment is planned for the exact due date. That triggers an operational risk warning, since there is no safety margin.
Even so, the process does not fail. It builds the status message, saves the request successfully, and finishes with the final result: BLOCKED and not scheduled.
Why This Matters in Real Projects
In small applications, debugging may be straightforward.
But in real-world enterprise APEX applications, a single page submit can trigger:
- multiple packages
- nested procedures
- integration calls
- complex validation layers
When that happens, trying to understand the execution flow without instrumentation becomes extremely difficult.
APEX_DEBUG solves that problem elegantly.
It allows you to turn your PL/SQL routines into observable processes where each important step is visible in the debug log.
For me, this approach has saved hours of investigation in production systems where reproducing issues is not always easy.
And once you start instrumenting your code consistently, debugging complex behavior becomes dramatically easier.
You can download the demo app used in this post on my GitHub: https://github.com/denioflavio/ap_payables